


Keith Myers & David Manley
The UK and Norway oil and gas sectors provide an ideal comparison through which to compare the outcomes from different approaches to oil sector governance. The two countries have equivalent geology and a similar resource base – the North Sea Basin is effectively split down the middle between them. [1] The UK and Norway both began offshore exploration and production in the mid-1960s with the first oil discoveries made in 1969. Since then, both countries have produced similar amounts of hydrocarbons: the UK has produced 42.8 billion barrels of oil equivalent (boe) and Norway 40 billion boe (figure 1).
Figure 1. UK and Norway oil and gas production since 1971
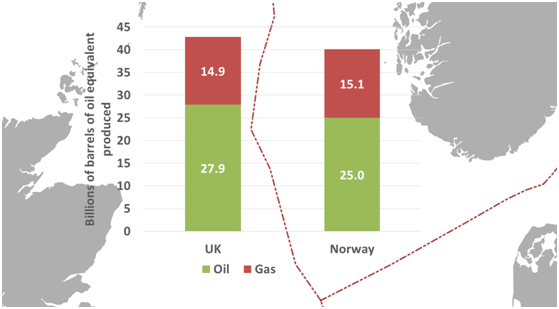 Source: BP Statistical Review 2014 and Norway government data (www.norskpetroleum.no)
Whilst the geology and resource base in each country is similar, the two countries have taken very different approaches to governance of the sector. Since 1986 the UK government has had effectively no direct equity participation in the North Sea and has had a fully private upstream sector, with taxation as the only channel of government revenues from hydrocarbons.[2]
Norway has taken a different approach, with over 50 percent of production coming through Statoil (of which the state owns a majority) and state ownership of assets via the State Direct Financial Interest (SDFI), held through Petoro (wholly owned by the state). Norway generated more than double the revenue the UK did from each barrel it produced. The purpose of this article is not to debate whether the current UK tax regime is optimal today, but rather examine why the Norwegian approach to oil governance in the past appears to have generated so much more revenue. For other countries seeking to extract more from their resources this case study suggests a valuable lesson: given political stability and competent institutions, a state can have both a relatively high tax burden on its industry and direct ownership of assets, and deliver more revenue for its citizens and still attract investment.
So how much revenue has each country generated from its oil and gas production over the past 45 years? Analysis of official government statistics show that the UK generated $470 billion in revenues whilst Norway has generated $1,197 billion since 1971 in real (2014) terms (figure 2). [3]
Figure 2. Government revenues from oil and gas production in real (2014) terms since 1970 [4]
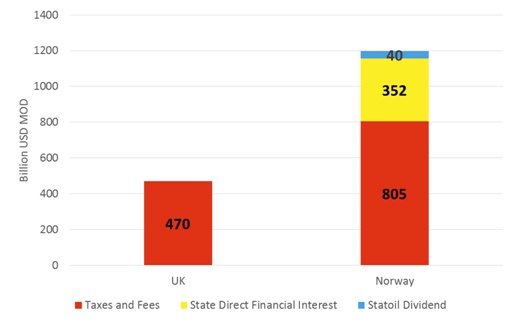 Source: UK Statistics of Government revenues from UK oil and gas production, table 11.11 and Norway government data (www.norskpetroleum.no).
Normalising for production levels shows that the UK generated $11.0 per boe compared to Norway’s $29.8 per boe in 2014 prices (figure 3). In other words, Norway has generated $18.8 per boe more in revenue for the state than the UK has. Figures 2 and 3 show that the difference is due to a combination of $9.1 less tax take per barrel and $9.8 per barrel in state equity cash flow and dividends.
Figure 3. Government revenues from oil and gas production in 2014 prices since 1970 on a barrel per oil equivalent basis
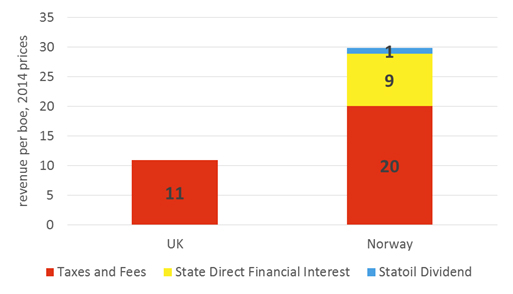 Source: UK Statistics of Government revenues from UK oil and gas production, table 11.11 and Norway government data (www.norskpetroleum.no).
The $18.8 per barrel extra government revenue Norway enjoyed equates to $727 billion in money of the day terms. On the face of it, this is a staggering sum, equivalent to 35 percent of the UK’s national debt stock in 2014.
Not included in these figures is the amount the UK state gained from selling its assets in the North Sea. This figure is not precisely known, but accounts suggest that UK earnings from the oil company privatisations in the early 1980s were only around £1.2 billion [5] ($1.7 billion) in money of the day terms, or around $3.76 billion in 2014 terms. This is perhaps an underestimate as it does not include income from the privatization of BG beyond its oil assets. Nonetheless, the income to the UK from privatization of oil assets does not make up for the lower UK government revenues relative to Norway.
Why did the UK generate less revenue for the state than Norway from North Sea oil and gas?
Three prominent factors appear to be 1) the timing of UK and Norway’s production relative to global oil and gas prices, 2) lower average UK tax receipts from petroleum production, and 3) the Norwegian state’s direct investment in the industry.
First, UK produced more of its oil and gas in years when prices were low than Norway did. The UK’s twin peaks of production in the late 80’s and late 90’s coincided with oil price lows resulting in less rent available to the UK state. Norway’s production peaked later, in 2004, when oil prices were higher (figure 4).
Figure 4. Oil and gas production and the oil price, in 2014 terms
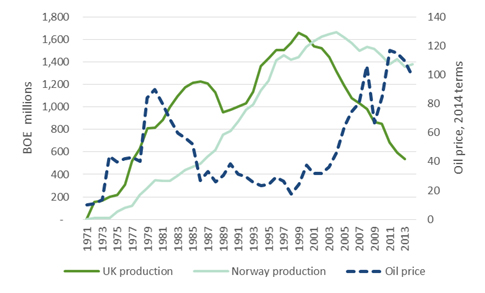 Source: BP Statistical Review 2014 and Norway government data (www.norskpetroleum.no).
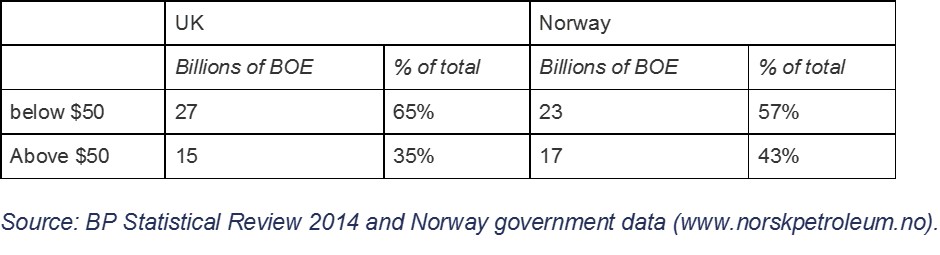
More precisely, the UK produced 65% of its oil when prices were below $50 a barrel compared to 57% for Norway. This seemingly small difference in realised sales has meant that Norway sold its oil and gas for about $10 per boe more than the UK on average.[6]
Table 1 Oil and gas produced in years when oil prices averaged below and above $50 per barrel in 2014 terms, from 1971
 Second, Norway earned $9 per boe more buy accutane online with paypal just in taxes. Partly this is an effect of the different in timing of sales, as already shown. In part it also reflects the larger field sizes in Norway [7] with consequent lower unit production costs and higher taxable profits. It also reflects differences in the tax regime as Norway has maintained a higher effective tax rate on the oil sector, although these rates have varied over time.[8]
The third factor in the apparent success of Norway has been the involvement of the state. The Norwegian state benefited from direct equity investment in the upstream which generated an additional $9.8 per barrel in revenue. The Norwegian state, via Statoil and Petoro, has majority stakes in 11 of its 14 billion barrel fields. This choice should be weighed against the fact that the Norwegian state risked public money. It is not clear how much this was. SDFI data shows negative cash flow from 1985 to 1988 of $21.4 billion in 2014 terms, but further public capital would have been invested before 1985. In hindsight this was a risk worth taking, but that could not have been known for certain at the time.
These figures suggest that Norway’s governance model has been a key contributing factor. Direct state equity in oil and gas production and a higher tax burden has generated significantly higher revenues for Norway, while the British state appears to have failed to gain much value from privatising its North Sea assets.
The UK government’s decision to end its direct participation in oil and gas equity was controversial at the time. In 1980, the Central Policy Review Staff with the UK cabinet office raised the following concerns “Privatising BNOC and selling £1 billion of BNOC’s assets benefits the PSBR (public sector borrowing requirement) in the years in which the assets are sold, but the £1 billion gained is purchased at a high price in terms of the PSBR benefits stretching out into the future.” Oil assets “are almost certain to rise in price in the years ahead”. [9]
This warning was prescient as our analysis shows that the UK government may have missed out on hundreds of billions of pounds in potential revenue as a result of the privatization path taken in the early 1980s. [10] Emerging oil and gas producers navigating the types of challenges the UK and Norway have already faced should take heed.
Keith Myers is the managing partner of Richmond Energy Partners, and a member of the Natural Resource Governance Institute (NRGI) advisory council. David Manley is an economic analyst at NRGI. With thanks to Dr Carole Nakhle and Willy Olsen for their thoughts.
[1] The North Sea accounts for the bulk of UK and Norway production. The UK also produces from the West of Shetlands and Norway has production in the Norwegian and Barents Sea
[2] Following the privatization of BNOC (BritOil 1982) and The British Gas Council’s oil assets (Enterprise Oil 1983) and gas assets (BG 1986)
[3] Official UK and Norway government data has been converted to US dollars at the prevailing exchange rates of the time, and adjusted for US inflation using data from the World Bank national accounts database via Index Mundi.
[4] Taxes and fees include standard business taxes, environmental and petroleum specific taxes, royalties and fees. The State Direct Financial Interest is the net return to the Norwegian State on its direct ownership interest in companies operating in Norway. This was started in 1985. Prior to this date, the State managed its interest via the state the owned company Statoil. After 1985, the State’s ownership interest was split: one part managed as the SDFI, and one part by Statoil. When Statoil was publically listed, the responsibility for managing the SDFI was transferred to a state-owned management company called Petoro. The Statoil Dividend is the total dividends paid by Statoil to the state as the sole shareholder from 1982 to the present, it does not include net income from 1972 when Statoil was founded.
[5] Britoil £549m, Enterprise Oil £392m, Wytch Farm £210m. Source: David Parker. The official history of privatization Vol 1 1970-1987. Routledge 2009.
[6] The average annual price of sales weighted by production has been $47 per boe for UK and $57 per boe for Norway.
[7] 67 percent of Norway’s production has been from large fields (over one billion boe), and 17 percent from small fields (between 0.5 and 1bn boe). In the UK, 23 percent of production has come from large fields and 26 percent from small fields. Source: Richmond Energy Partners.
[8] In terms of the tax take per dollar of sale weighted by production, Norway has received 16 cents more than the UK. Authors’ estimate based on analysis of UK Government statistics, and Nakhle, C. (2008) “Petroleum taxation. Sharing the oil wealth: a study of petroleum taxation yesterday, today and tomorrow”, Routledge Studies in International Business and the World Economy.
[9] David Parker. The official history of privatization Vol 1 1970-1987 Routledge 2009
[10] For a commentary on the policy implications and supporting analysis see Boué, J. C and Wright, P. “Chapter 2. A requiem for the UK’s Petroleum Fiscal Regime” in Rutledge, I. and Wright, P. (eds) UK Energy Policy and the End of Market Fundamentalism. 2011. Oxford Institute for Energy Studies.