


Dr Carole Nakhle
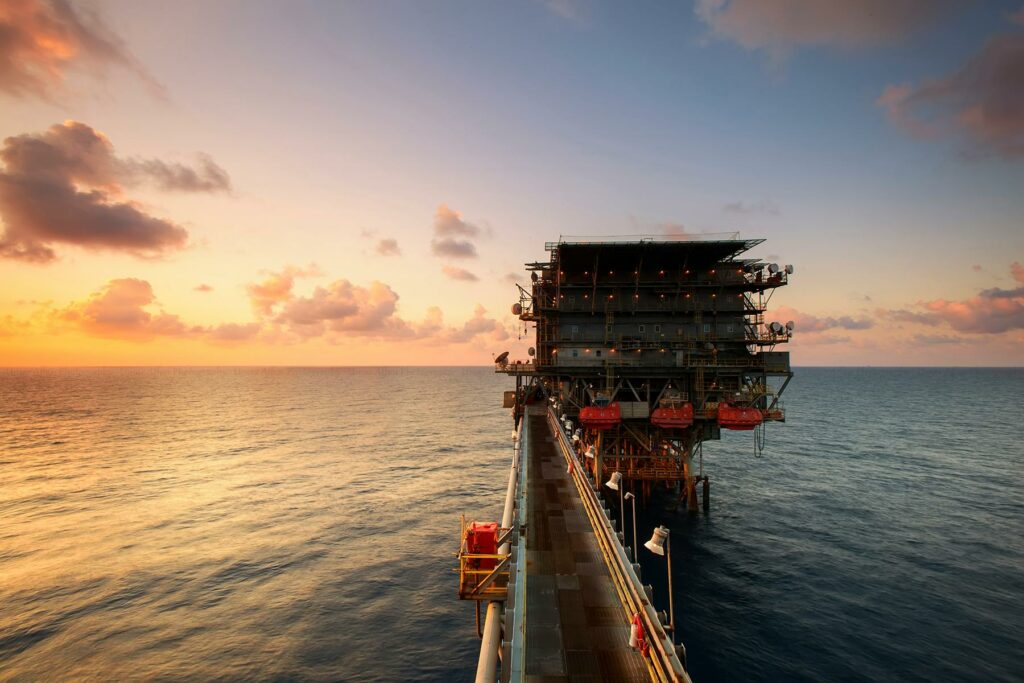
Primarily an American story, the “shale revolution” ended up having a transformational impact on both the United States and global gas markets, especially in Europe and Asia. The most notable effects have been on the trade of liquefied natural gas (LNG), with spillovers into pipeline gas markets.
Today, LNG markets are undergoing a structural change. Supply has been growing rapidly and the industry is shifting from a traditional point-to-point delivery business model (e.g., from Australia to Japan) toward a flexible, integrated global market. U.S. LNG, which is sold under flexible terms (spot pricing and short-term contracts), has been fueled by a rapid buildup in shale gas production. The rise of U.S. LNG has challenged established exporters, such as Russia and Qatar, and the old pricing order, while tilting the bargaining power in favor of consumers.
Domestic impact
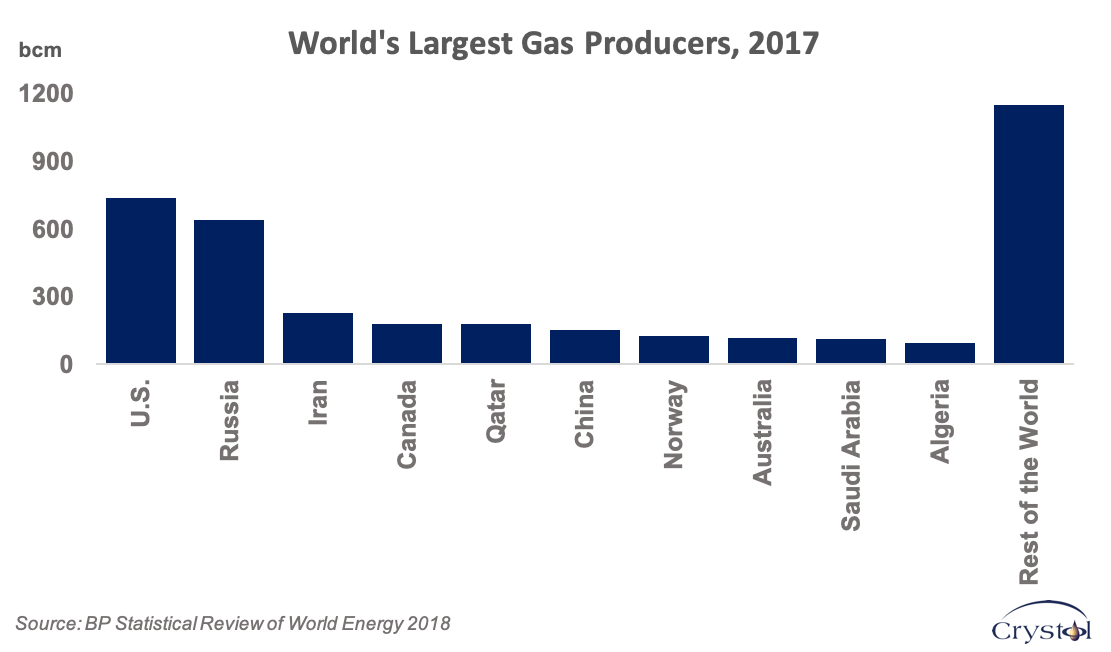
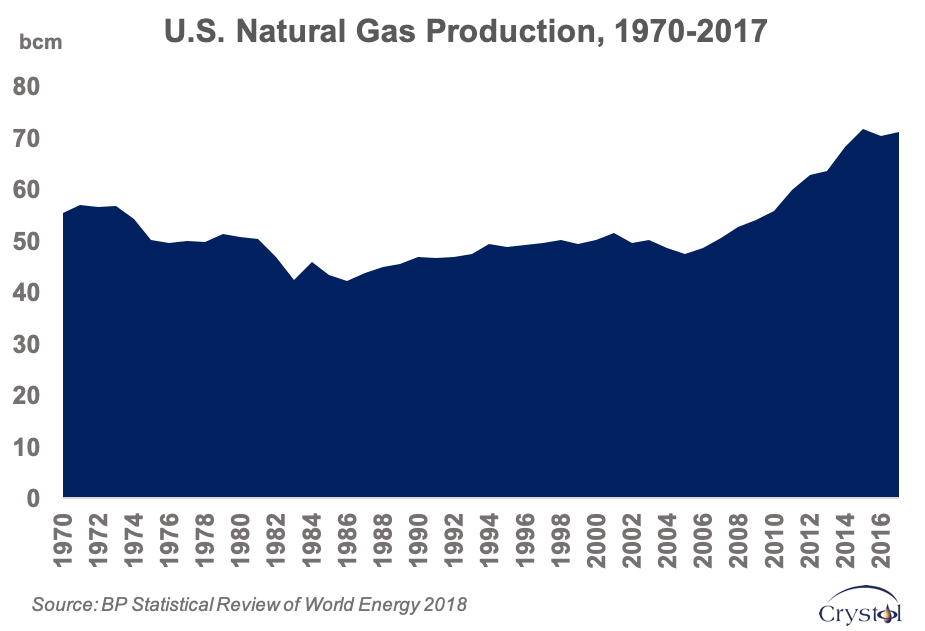
Following the shale revolution, U.S. gas production staged an impressive recovery, reversing decades of decline. In 2009, the U.S. overtook Russia as the world’s largest gas producer, and has since maintained that position despite being only the fifth-largest holder of proven gas reserves, after Russia, Iran, Qatar and Turkmenistan, according to the BP Statistical Review of World Energy.
In 2011, thanks to shale, U.S. gas production exceeded its previous peak from 1973 and in the years since has continued on a new path of expansion. Shale is expected to reach its highest level of production in the early 2030s, according to the International Energy Agency (IEA), which also forecasts that the U.S. will account for 40 percent of total growth in gas output to 2025; in the late 2020s, the country is expected to produce a third more gas than the next largest producer, Russia.
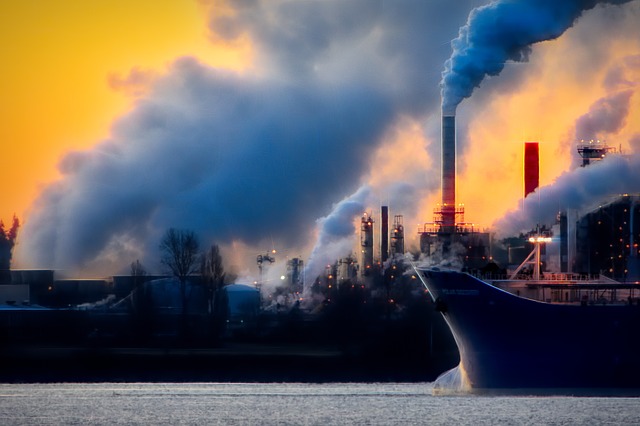
The immediate impact of this reversal of fortune was first felt at home. Plentiful supplies and lower prices encouraged a shift in American power generation from coal to gas. From the perspective of climate change policies, gas-fired plants produce 40 to 50 percent fewer carbon dioxide (CO2) emissions than coal, per kilowatt hour generated. As a result, the climate footprint of the U.S. energy industry declined along with the rise of shale. In 2017, the U.S. Environmental Protection Agency (EPA) showed decreases in overall emissions across sectors, with total greenhouse gas emissions decreasing by 2.7 percent from 2016 to 2017 – a boon for the current administration. EPA Administrator Andrew Wheeler boasted last year that “thanks to President Trump’s regulatory reform agenda, the economy is booming, energy production is surging, and we are reducing greenhouse gas emissions from major industrial sources.”
The increase in domestic production also fundamentally altered U.S. gas trade. A decade ago, the U.S. was expecting large LNG imports due to falling indigenous supplies and rising demand. The shale gas revolution has turned the U.S. from a net LNG importer into an exporter, and LNG facilities that were originally built for imports have been converted into export terminals. As the shale gas boom commenced in earnest around 2010, suppliers that were counting on U.S. gas demand had to look to Europe and Asia. (When the Fukushima earthquake hit Japan in 2011, this slack in the LNG market provided the flexibility to make up for nuclear power shortfalls.)
Although the U.S. is at a slight disadvantage on price compared with Qatar, the leading LNG exporter, its product is available on more flexible terms – primarily through spot pricing rather than long-term contracts. This has forced major exporters like Russia and Qatar to rethink their long-term contracts and consider greater flexibility to safeguard their business, especially in traditional markets.
European battlefield
Europe remains a key market for natural gas, both in terms of its overall consumption and as a center for competition among different sources of supply. The region accounted for 13 percent of global gas consumption in 2017, according to BP. Declining domestic production also means that Europe’s reliance on imports will increase.
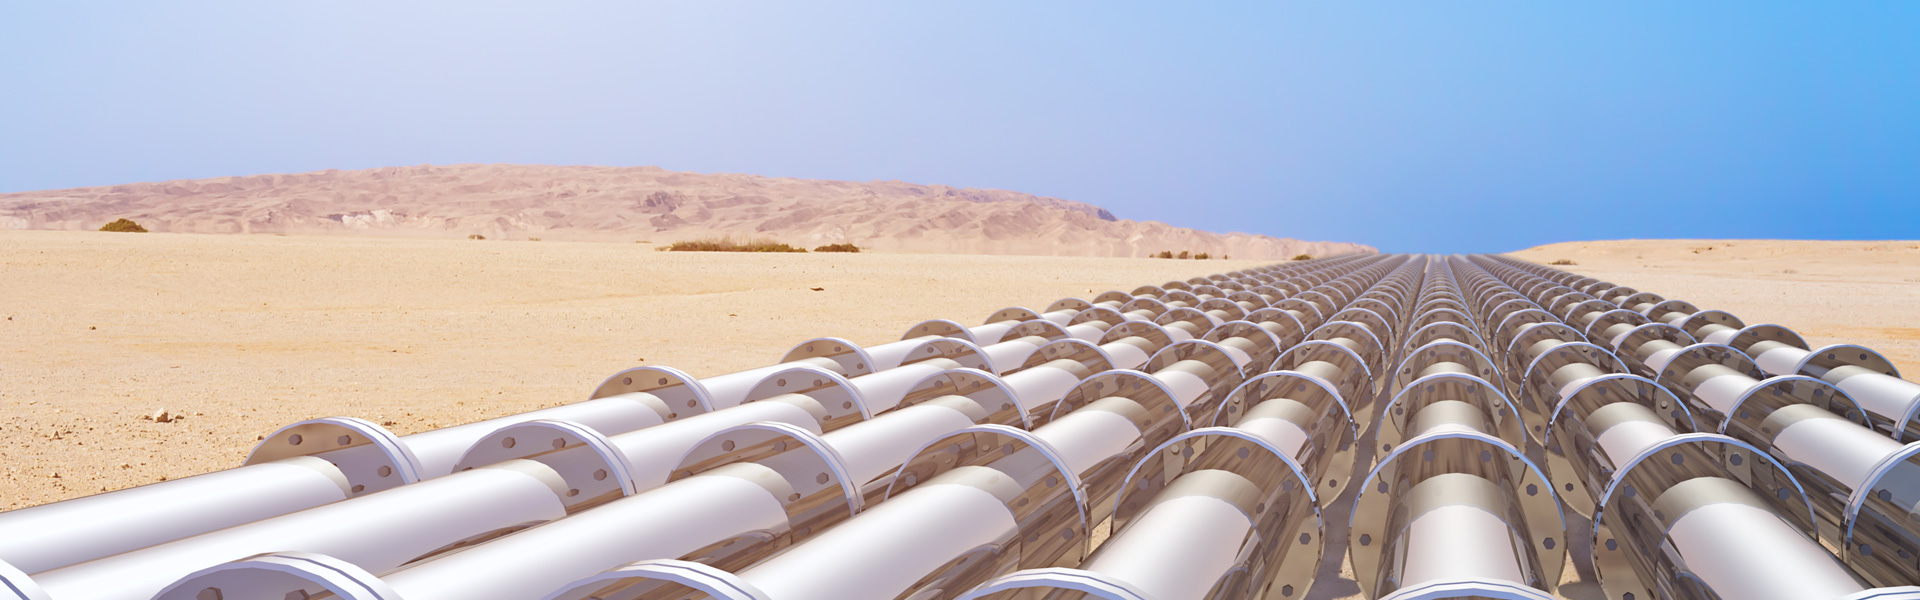
The diversification of energy supplies is highly politicized in the European Union, particularly regarding natural gas. The European Commission has made security of supply an explicit policy objective, which “includes identifying and building new routes that decrease the dependence of EU countries on a single supplier of natural gas and other energy resources.” The “single supplier” is understood to be Russia. Most of Europe’s gas is imported from that country, but the dependency cuts both ways; 68 percent of Europe’s net gas imports are Russian pipeline gas, while those exports constitute some 75 percent of Russia’s entire pipeline gas trade.
The EU is now taking several measures to reduce its dependency on Russia, including the promotion of LNG, and new exporters with flexible cargos (like the U.S.) are taking advantage. Political backing is coming in handy. The EU and the U.S. entered into a strategic cooperation on energy in 2018 that seeks greater LNG imports from the U.S., with the first EU-U.S. Energy Council forum to be held in Brussels in May 2019.
The U.S. is also reportedly trying to block completion of the Nord Stream 2 pipeline between Russia and Germany, viewing it as a threat to European energy security and to economic prosperity in Ukraine, which the pipeline would bypass. In response, and also to protect its market share in such a key market, Gazprom has offered price discounts to many of its customers. In 2018, the company publicly announced that one-third of its contracts were linked to hub prices and another third were hybrid spot- and oil-indexed contracts. Such a lenient attitude was inconceivable only a few years ago.
Asian powerhouse
Asia is expected to be the growth center for oil and gas in the coming decades, with China leading that growth. For natural gas, the potential is massive. The share of natural gas in China’s primary energy mix still stands at a modest 7 percent (compared with a world average of 24 percent). China’s economic growth and a policy effort to improve air quality are turning the country into one of the world’s largest natural gas consumers and importers, despite growing domestic production.
The country is now seeking new pipeline and LNG imports. Today, China’s natural gas consumption is the third largest in the world, more than twice the size of Japan’s, the next largest Asian consumer. According to the IEA, China is set to become the world’s largest natural gas importer in 2019, and its volume of gas imports could match that of the EU by 2040.
China’s search for new supplies will favor highly available and flexible LNG. In terms of volume, the main suppliers are likely to remain Australia and Qatar, which is not surprising given their proximity and scale of resources. However, despite the distance, flexible exports from the U.S. are exerting stronger competitive pressures in the Asian market. Spoiled for choice, China has found itself in a strong position to negotiate favorable contractual terms; Qatar, for example, agreed to modify existing contracts in 2015 to retain market share.
Unlike in Europe, however, politics may temporarily limit the impact of American supplies in Asia. China seems to be using LNG as a weapon in its trade dispute with the U.S, as can be seen by its imposition of a 10 percent tariff on U.S. LNG imports in September 2018. However, the plain fact is that competition between old and new LNG exporters is set to increase in all regions, encouraging greater flexibility to defend market share. That will remain true even for traditional pipeline exporters, despite their cost advantage.
The changing global gas market
- Unlike oil, which is a fungible commodity traded in a global market, the natural gas trade remains a mostly regional affair, with three main markets in North America, Europe and Asia. Around 70% of the gas produced globally is consumed locally
- Europe’s overall import dependency stands at around 40% while that of EU member countries is 75%
- The U.S. is forecast to have the third-largest LNG export capacity in the world by the end of 2019, after Australia and Qatar
- Global LNG capacity is on track to grow 20% between 2018 and 2020, with the U.S. providing around half of this growth. Australia and Russia will provide most of the rest (IEA)
- In Asia, Japan is the largest market. China overtook South Korea for second place in 2017
The article was first published in the Geopolitical Intelligence Services
Related Analysis
“Shale energy shows the power of markets”, Dr Carole Nakhle, May 2017